Image Details
Theoretical Transmission Spectra of Exoplanet Atmospheres with Hydrocarbon Haze: Effect of Creation, Growth, and Settling of Haze Particles. II. Dependence on UV Irradiation Intensity, Metallicity, C/O Ratio, Eddy Diffusion Coefficient, and Temperature
2019 The Astrophysical Journal 877 109.
- Provider: AAS Journals
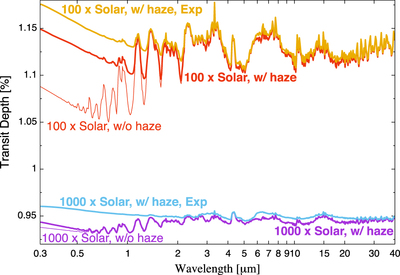
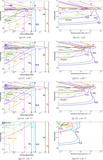
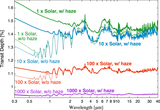
Caption: Figure 22.
Transmission spectrum models for the hazy 100 × solar atmospheres calculated with ﹩\dot{M}﹩exp (yellow line) and ﹩\dot{M}﹩ (thick red line; same as the thick red line in Figure 9) and 1000 × solar atmospheres calculated with ﹩{\dot{M}}_{\exp }﹩ (light-blue line) and ﹩\dot{M}﹩ (thick purple line; same as the thick purple line in Figure 9) . See the text for the definition of each quantity. The transmission spectrum for the 100 × solar and 1000 × solar atmospheres without haze is also plotted as the thin red line (same as the thin red line in Figure 9) and thin purple line (same as the thin purple line in Figure 9), respectively. Note that the transmission spectrum models are smoothed for clarity.
Other Images in This Article
Show More
Copyright and Terms & Conditions
© 2019. The American Astronomical Society. All rights reserved.