Image Details
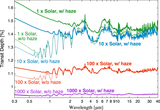
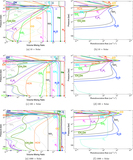
Theoretical Transmission Spectra of Exoplanet Atmospheres with Hydrocarbon Haze: Effect of Creation, Growth, and Settling of Haze Particles. II. Dependence on UV Irradiation Intensity, Metallicity, C/O Ratio, Eddy Diffusion Coefficient, and Temperature
2019 The Astrophysical Journal 877 109.
- Provider: AAS Journals
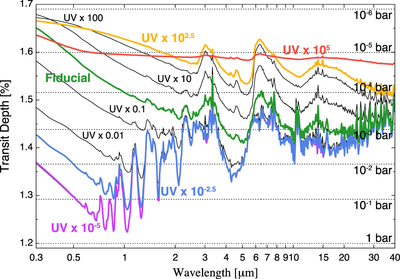
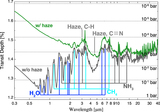
Caption: Figure 6.
Transmission spectrum models for the atmosphere with haze for nine different choices of UV irradiation intensity: 105 (red line), 102.5 (yellow line), 100, 10, 0.1, 0.01 (all represented by black thin lines), 10−2.5 (blue line), and 10−5 (purple line) times the fiducial value (green line; same as the green line in Figure 5). All of the lines except the fiducial one are labeled “UV× n” (n = 105, 102.5, 100, 10, 0.1, 0.01, 10−2.5, 10−5). The haze-free transmission spectrum for the fiducial UV intensity is also plotted (black line; same as the black line in Figure 5), but can hardly be seen because it overlaps with that for the atmosphere with haze in the case of UV × 10−5 (purple line). As in Figure 5, the horizontal dotted lines represent the transit depths corresponding to pressure levels from 1 × 10⁻⁶ bar to 1 bar for the atmosphere in the fiducial UV case. Note that the transmission spectrum models are smoothed for clarity.
Other Images in This Article
Show More
Copyright and Terms & Conditions
© 2019. The American Astronomical Society. All rights reserved.