Image Details
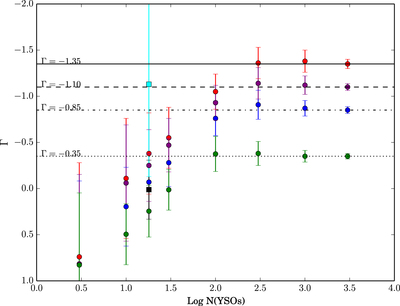
Caption: Figure 8.
Derived IMF slope ﹩{\rm{\Gamma }}\equiv d(\mathrm{log}N))/d(\mathrm{log}M)﹩ as a function of simulated cluster size for clusters following different underlying IMFs. Red dots correspond to a cluster with an intrinsic Γ = −1.35, purple follow Γ = −1.10, blue follow Γ = −0.85, and green follow Γ = −0.35. Error bars correspond to the standard deviation of the simulated clusters. The black square corresponds to our observed IMF slope based on the best-fit YSO masses, and the cyan corresponds to the average mass values.
Other Images in This Article
Copyright and Terms & Conditions
© 2019. The American Astronomical Society. All rights reserved.
Copyright ©
2025 Astronomy Image Explorer. All Rights Reserved.