Image Details
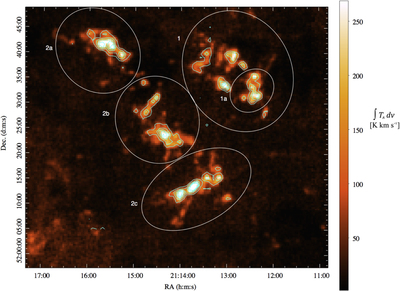
Caption: Figure 1.
Integrated 12CO map of CTB 102. Integration was between VLSR = −71 km s−1 and −53 km s−1. White ellipses denote the four main subdivisions of the molecular cloud (1, 2a, 2b, and 2c) along with the smaller 1a region that has a high concentration of YSOs. Cyan contours show the integrated 13CO emission. Five contour levels were generated starting 3σ above the median background. The morphology of the molecular cloud is very similar in both the 12CO and 13CO maps.
Other Images in This Article
Copyright and Terms & Conditions
© 2019. The American Astronomical Society. All rights reserved.
Copyright ©
2025 Astronomy Image Explorer. All Rights Reserved.