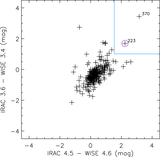
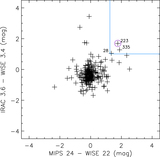
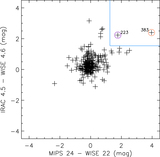
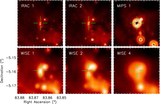
Image Details
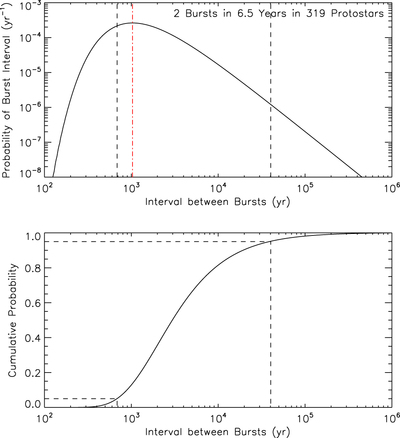
Caption: Figure 12.
Top: posterior probability ﹩P\left({I}_{b}| {n}_{b},{N}_{p},{\rm{\Delta }}t\right)﹩ after observing two outbursts in 319 protostars over a 6.5 yr window as a function of outburst interval. The probability peaks at about 1040 yr (red dotted–dashed line). Dotted lines illustrate the 90% confidence interval, which is from 690 to 40,300 yr. Bottom: the cumulative probability distribution, which further illustrates the confidence interval.
Other Images in This Article
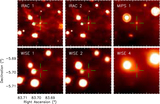
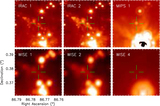
Show More
Copyright and Terms & Conditions
© 2019. The American Astronomical Society. All rights reserved.
Copyright ©
2025 Astronomy Image Explorer. All Rights Reserved.