Image Details
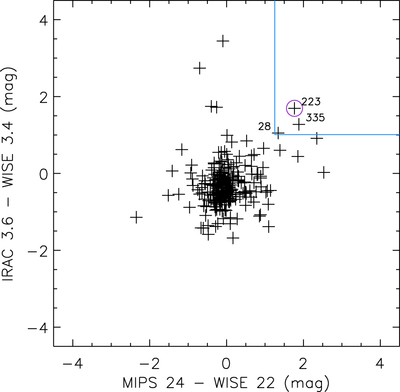
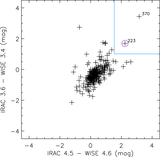
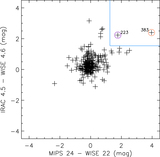
Caption: Figure 5.
Magnitude differences between IRAC 1 and W1 plotted against the magnitude differences between MIPS 1 and W4 for the 233 protostars detected in all four bands. The lines, the annotations, and the purple circle have the same meaning as in Figure 4.
Other Images in This Article
Show More
Copyright and Terms & Conditions
© 2019. The American Astronomical Society. All rights reserved.
Copyright ©
2025 Astronomy Image Explorer. All Rights Reserved.