Image Details
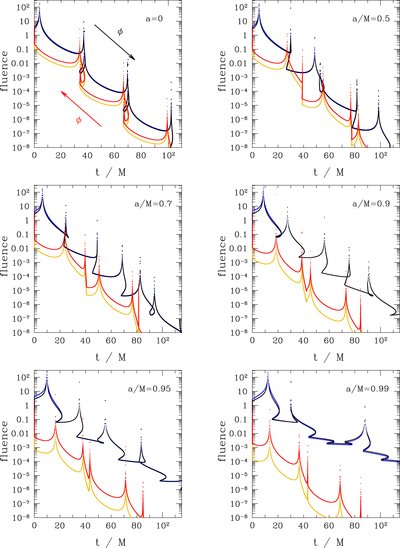
Caption: Figure 10.
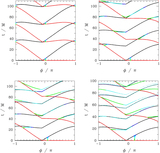
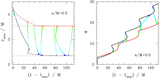
Same as Figure 7, but now fluence vs. time, for observers positioned at colatitude θ = π/2. Black/red points show the prograde/retrograde ray fluence and track the corresponding curves on the t–ϕ plot, with angles ϕ = −π and π identified. Blue and gold points show the energy fluence, weighted by the energy integral of each ray.
Other Images in This Article
Show More
Copyright and Terms & Conditions
© 2019. The American Astronomical Society. All rights reserved.
Copyright ©
2025 Astronomy Image Explorer. All Rights Reserved.