Image Details
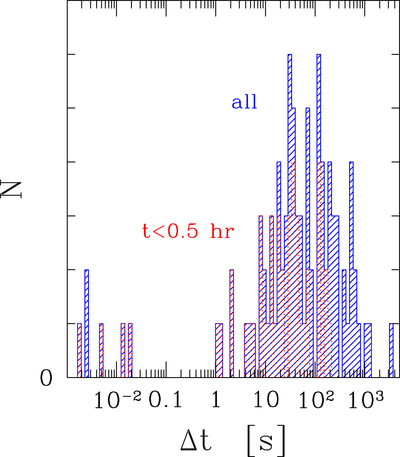
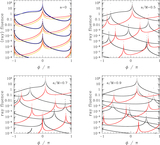
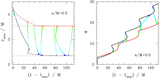
Caption: Figure 14.
Histogram of intervals between successive bursts, as recorded from FRB 121102 in a single ∼4.5 hr cluster by Zhang et al. (2018). Red histogram is the subsample of bursts arriving earlier than 0.5 hr from the start of the observation.
Other Images in This Article
Show More
Copyright and Terms & Conditions
© 2019. The American Astronomical Society. All rights reserved.
Copyright ©
2025 Astronomy Image Explorer. All Rights Reserved.