Image Details
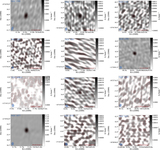
Caption: Figure 5.
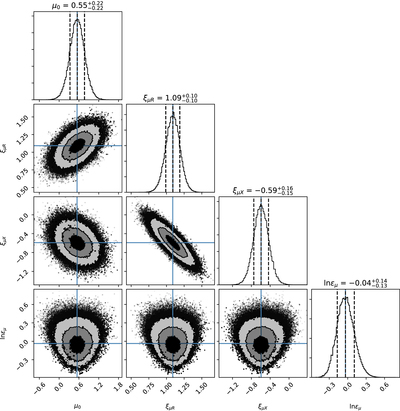
A Foreman-Mackey (2016) corner plot of MCMC results. Each panel in this corner plot of our MCMC results shows either the posterior probability distribution of an individual parameter in our fits (histograms) or the joint posterior probability distribution of pairs of parameters (scatter plots). The equations at the top of each column show the median and 68% interval of each parameter, μ0 = 0.55 ± 0.22, ξμR = 1.09 ± 0.10, ﹩{\xi }_{\mu X}=-{0.59}_{-0.15}^{+0.16}﹩, and ﹩\mathrm{ln}{\epsilon }_{\mu }=-{0.04}_{-0.13}^{+0.14}﹩. The posterior distributions show well-behaved, mono-modal distributions. The joint posterior distributions show some covariance between ξμR and ξμX as well as between μ0 and either of ξμR and ξμX. The asymmetry in the joint posterior distributions that include ﹩\mathrm{ln}{\epsilon }_{\mu }﹩ is typical when using a logarithmic intrinsic scatter term. For comparison, the corresponding fits from Gültekin et al. (2009a) are μ0 = 0.19 ± 0.19, ξμR = 0.48 ± 0.16, ξμX = −0.24 ± 0.15, and ﹩\mathrm{ln}{\epsilon }_{\mu }=-0.26﹩.
Other Images in This Article

Copyright and Terms & Conditions
© 2019. The American Astronomical Society. All rights reserved.