Image Details
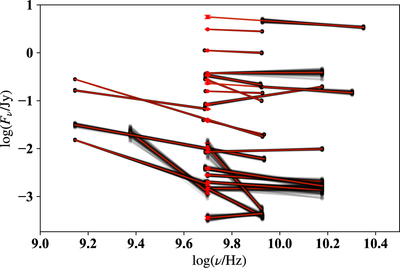
Caption: Figure 4.
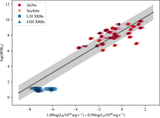
A summary plot of radio data for all AGN for which we have calculated radio spectral indexes (α). Each set of black lines was constructed by doing Monte Carlo simulations of the measurements of the source at each frequency assuming a Gaussian distribution with dispersion equal to their 1σ uncertainties. Because the sources are all at low redshift, the correlated uncertainties in distance do not come into effect here, and we just plot flux density. Then, we calculate α for the two values. We do this for 105 realizations, but we only plot a random subset of 100 of them. For using a single value of alpha for our tables, we use the median value of alpha with the 68% intervals for our 1σ uncertainties. We plot, in red, the median value and the median interpolated/extrapolated value for the 5 GHz Fν value with 1σ error. Although we plot the medians for reference, we use the Monte Carlo realizations for each of our fit realizations. In this way, e.g., a source with α = 0.3 ± 0.1, will be classified and treated as a flat source for the roughly 84% of the time that α < 0.4.
Other Images in This Article

Copyright and Terms & Conditions
© 2019. The American Astronomical Society. All rights reserved.