Image Details
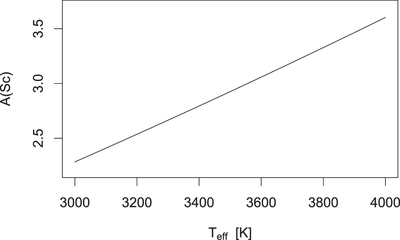
Caption: Figure 4.
This plot assumes a Sc I line with a fixed equivalent width of 300 mÅ, as might be the situation when analyzing an observed spectrum. Plotted is the number density abundance of scandium as a function of temperature derived from this Sc I line. The plot shows how cooler temperatures counteract higher abundances when modeling such a feature. Note that a temperature difference of 100 K corresponds to an abundance difference of more than 0.1 dex. The metallicity is assumed to be solar, and the surface gravity is assumed to follow isochrone relations with varying temperature. Non-LTE and 3D effects are not considered.
Other Images in This Article
Copyright and Terms & Conditions
© 2018. The American Astronomical Society. All rights reserved.