Image Details
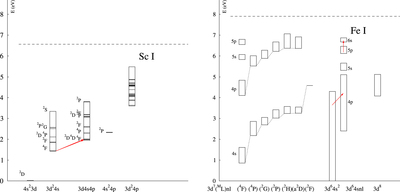
Caption: Figure 2.
Energy level diagrams for Sc I and Fe I, respectively. The vertical energy scale is the same, and the dashed line shows the ionization energy. The observed lines are marked with red arrows. Note that the near-IR Sc I lines are located at significantly lower excitation energies compared to the near-IR Fe I lines.
Other Images in This Article
Copyright and Terms & Conditions
© 2018. The American Astronomical Society. All rights reserved.
Copyright ©
2026 Astronomy Image Explorer. All Rights Reserved.