Image Details
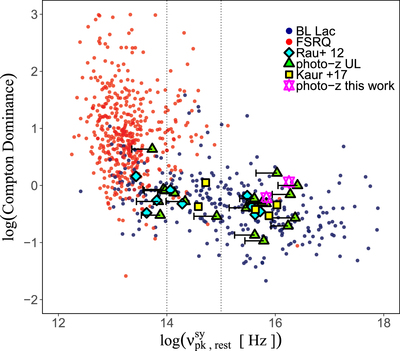
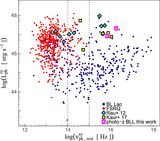
Caption: Figure 6.
Relationship between the Compton dominance and ﹩{\nu }_{\mathrm{sy}}^{\mathrm{pk}}﹩. The color scheme for data symbols follows from Figure 5. All of the upper limits, including the ones from this work are represented by green filled triangles. The black horizontal lines represent the range of ﹩{\nu }_{\mathrm{sy}}^{\mathrm{pk}}﹩ for redshifts from zero to the upper limits, provided in our sample.
Other Images in This Article

Copyright and Terms & Conditions
© 2018. The American Astronomical Society. All rights reserved.
Copyright ©
2025 Astronomy Image Explorer. All Rights Reserved.