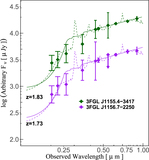
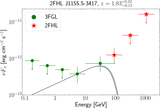
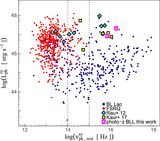
Image Details
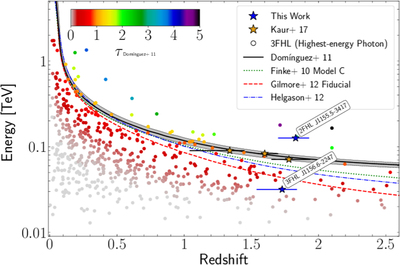
Caption: Figure 4.
Cosmic γ-ray horizon plot: the highest energy of photons from sources (with E > 50 GeV) vs. their redshift. The colors of sources imply their corresponding optical depth (τ) values (see the colorbar). Various estimates of the cosmic γ-ray horizon, obtained from the EBL models by Finke et al. (2010, dotted green line), Domínguez et al. (2011, solid black line, with uncertainties represented by the shaded band), Gilmore et al. (2012, dashed red line), and Helgason & Kashlinsky (2012, dotted–dashed blue line) are plotted for comparison. The highest energy photons from one of the two high-z sources lie above the cosmic γ-ray horizon (blue filled stars), whereas the other source lies below this limit. The three orange star symbols represent the high-z BL Lacs found in Rau et al. (2012) and Kaur et al. (2017), for which 2FHL data were available.
Other Images in This Article

Copyright and Terms & Conditions
© 2018. The American Astronomical Society. All rights reserved.