Image Details
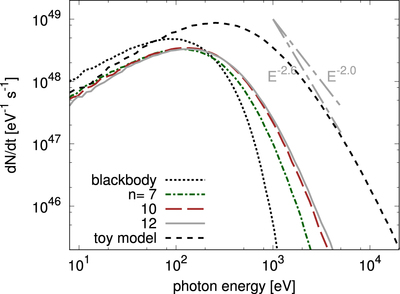
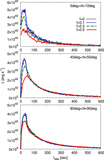
Caption: Figure 14.
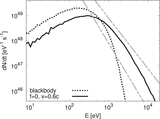
Time-integrated spectra calculated using the 1D Chevalier self-similar solution for n = 7, 10, and 12 and that of a blackbody at a temperature of ﹩{k}_{{\rm{B}}}{T}_{2,\mathrm{ch}}﹩ (black dotted line). The black short-dashed line displays the solid curve of Figure 5.
Other Images in This Article
Show More
Copyright and Terms & Conditions
© 2018. The American Astronomical Society. All rights reserved.
Copyright ©
2025 Astronomy Image Explorer. All Rights Reserved.