Image Details
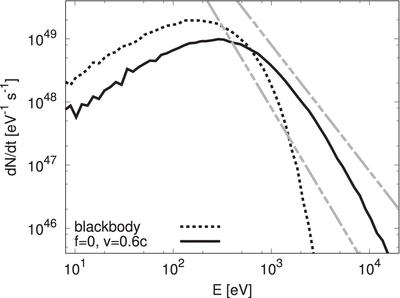
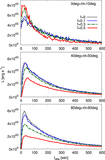
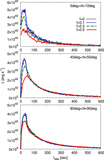
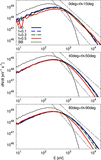
Caption: Figure 5.
Time-integrated spectrum of emission from a spherically symmetric shock (solid curve). The dotted curve represents a blackbody spectrum at a temperature of ﹩{k}_{{\rm{B}}}{T}_{{\rm{b}}}﹩. The gradients of the straight lines are −2.0 and −2.6, which correspond to the ﹩\pm 1\sigma ﹩ values of those of the observed Swift/XRT spectrum.
Other Images in This Article
Show More
Copyright and Terms & Conditions
© 2018. The American Astronomical Society. All rights reserved.
Copyright ©
2025 Astronomy Image Explorer. All Rights Reserved.