Image Details
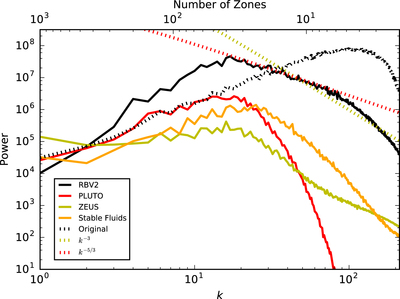
Caption: Figure 4.
Resultant energy spectra (after 20 sound-crossing times of evolution) of the two-dimensional simulations depicted in Figure 3, for RBV2 (black solid), PLUTO (red solid), ZEUS (green solid), and Stable Fluids (yellow solid). Lines corresponding to spectra with slopes ﹩{k}^{-5/3}﹩ and ﹩{k}^{-3}﹩ are plotted with dashed orange and green lines, respectively. The lower x-axis shows the wavenumber k for each mode, while the upper x-axis shows the corresponding number of zones needed to represent one full cycle for each k disturbance.
Other Images in This Article

Copyright and Terms & Conditions
© 2017. The American Astronomical Society. All rights reserved.
Copyright ©
2026 Astronomy Image Explorer. All Rights Reserved.