Image Details
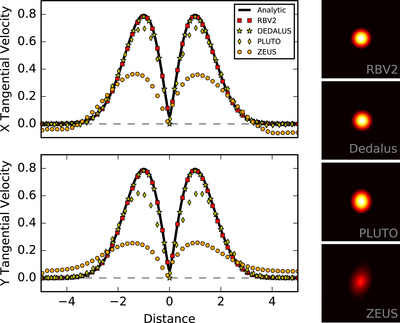
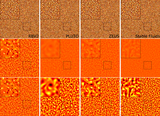
Caption: Figure 2.
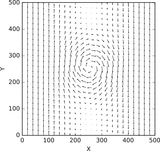
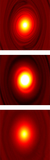
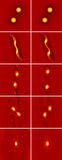
Left panels: x-directional and y-directional cross sections of the tangential velocity of the seeded Yee et al. (1999) vortex following significant hydrodynamical evolution. The seeded, analytic velocity profile is shown with the black solid line and is unchanging in time. The red squares, yellow stars, yellow diamonds, and orange circles show the vortex’s velocity profile after 100 orbits as evolved with the RBV2, Dedalus, PLUTO (WENO+RK3), and ZEUS (van Leer) codes, respectively. Right panels: color-coded maps of the vorticity after 100 orbits of the entire vortex in RBV2, Dedalus, PLUTO, and ZEUS (right panels, top to bottom). The initial vorticity is almost indistinguishable from that shown in RBV2 and Dedalus, and the maximum vorticity in the initial and RBV2, Dedalus, PLUTO, and ZEUS evolved vortex is 2.62, 2.62, 2.62, 2.54, and 1.09, respectively. All simulations were run with 256 × 256 zones, and PLUTO was run with RK3 time stepping and the WENO3 (weighted essentially nonoscillatory) reconstruction scheme (Liu et al. 1994). Dedalus was run solving the Navier–Stokes equation with a kinematic viscosity ﹩\nu \sim 1\times {10}^{-5}﹩. While Dedalus and RBV2 both maintain the analytic solution to high fidelity, RBV2 is computationally faster by a factor of 10.
Other Images in This Article

Copyright and Terms & Conditions
© 2017. The American Astronomical Society. All rights reserved.