Image Details
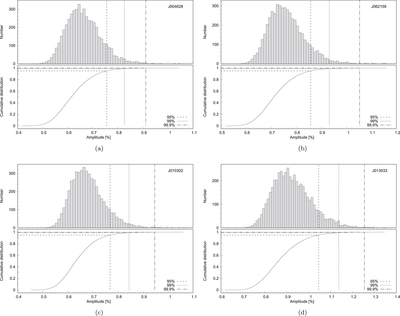
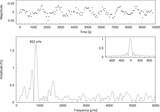
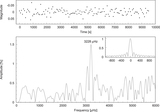
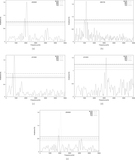
Caption: Figure 6.
Simulation results for (a) J004628, (b) J062159, (c) J010302, and (d) J013033. The upper panel of each subfigure shows the distribution of the highest amplitudes in 10,000 simulations. The bottom panel shows the corresponding CDF. The locations of the 95%, 99%, and 99.9% confidence levels are marked with the dashed, dotted, and dashed–dotted lines, respectively.
Other Images in This Article
Copyright and Terms & Conditions
© 2017. The American Astronomical Society. All rights reserved.
Copyright ©
2025 Astronomy Image Explorer. All Rights Reserved.