Image Details
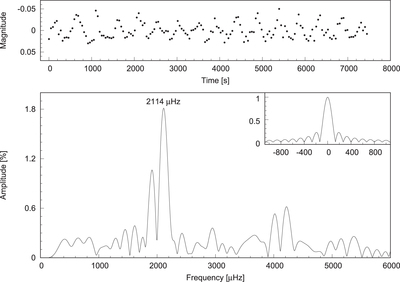
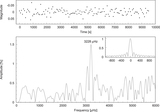
Caption: Figure 2.
The upper panel shows the normalized light curve of J004628. The x-axis is the time in seconds and the y-axis is the differential magnitude of J004628 relative to the comparison star. The zero point is the average of the light curve. The bottom panel shows the amplitude spectrum of the light curve. The relative amplitude is plotted versus the frequency in the range from 0 to 6000 μHz. The inset shows the spectral window.
Other Images in This Article
Copyright and Terms & Conditions
© 2017. The American Astronomical Society. All rights reserved.
Copyright ©
2025 Astronomy Image Explorer. All Rights Reserved.