Image Details
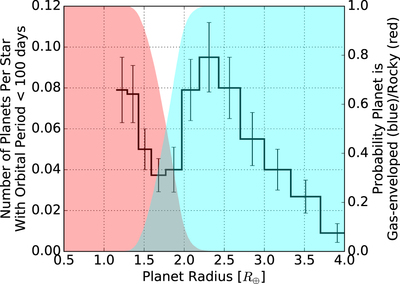
Caption: Figure 5.
Exoplanet data from Fulton et al. (2017) is shown in the black curve (data taken from Fulton et al. 2017 Table 3). Our model predictions are shown by the shaded regions. Using the probability distribution generated in Figure 2, the red shaded region shows the probability that a planet is below the rocky planet cutoff, and the blue shaded region shows the probability that a planet is above the rocky planet cutoff. Beyond ∼1.5 R⊕, planets are unlikely to be rocky, while below ∼2 R⊕, planets are unlikely to be gas-enveloped. Thus, our model predicts a lack of exoplanets with radii between 1.5 and 2 R⊕, which is indeed seen in the Fulton et al. (2017) data. Fulton et al. (2017) found that planets below ∼1.8 R⊕ are likely to be rocky, while larger planets are likely to be gas-enveloped, which agrees with our results. It should be noted that the vertical axes in this plot are arbitrarily scaled. The important feature, however, is the location of the transition between rocky and gas-enveloped planets and the width of the valley between that transition, which is agnostic of the vertical scaling.
Other Images in This Article

Copyright and Terms & Conditions
© 2017. The American Astronomical Society. All rights reserved.