Image Details
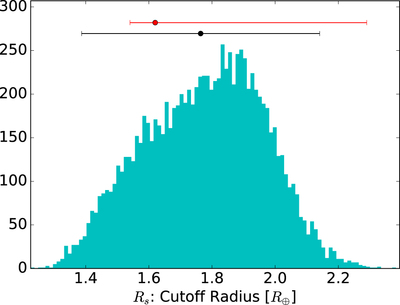
Caption: Figure 2.
Ten thousand random parameter combinations were considered using a uniform distribution of the ranges given in Table 1 to calculate the cutoff between rocky and gas-enveloped planets. The number of resulting surface radii, Rs, at which the cutoff occurred for each parameter combination is shown in the histogram. The black dot and error bar show the mean cutoff of the distribution at 1.76 ± 0.38 R⊕ from our model with 2σ uncertainty. The red dot shows the observed ﹩{1.62}_{-0.08}^{+0.67}\,{R}_{\oplus }﹩ measurement with 2σ uncertainty from Rogers (2015).
Other Images in This Article

Copyright and Terms & Conditions
© 2017. The American Astronomical Society. All rights reserved.
Copyright ©
2025 Astronomy Image Explorer. All Rights Reserved.