Image Details
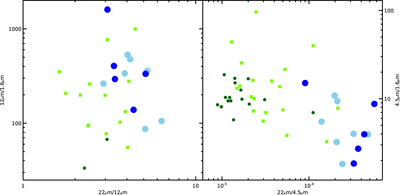
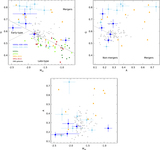
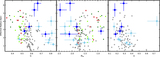
Caption: Figure 4.
Two color–color plots for our sample, with the pDOGs and bDOGs (Section 5.1) also shown. Only those objects with detections in all relevant bands are plotted. See Figure 3 for a key to the points.
Other Images in This Article
Copyright and Terms & Conditions
© 2017. The American Astronomical Society. All rights reserved.
Copyright ©
2025 Astronomy Image Explorer. All Rights Reserved.