Image Details
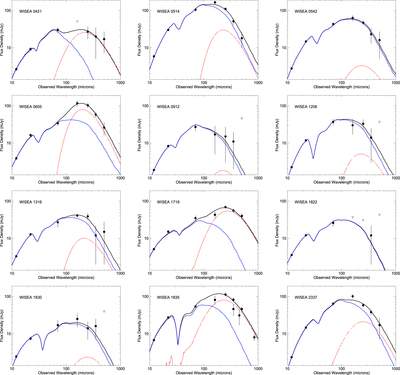
Caption: Figure 2.
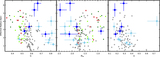
Mid- to far-infrared observed-frame SEDs of our sample. In each panel, the black line is the combined best-fit model, the blue dashed line is the AGN component, and the red dotted line is the starburst component. Photometry is presented as 3σ upper limits (gray triangles) if detections are below 1σ significance. The ground-based photometry from Table 1 is also plotted. We show only the SEDs at >4.5 μm, as our fitting approach does not include a host galaxy component. Nevertheless, the fit is always consistent with the shorter-wavelength data, either as fluxes or upper limits.
Other Images in This Article
Copyright and Terms & Conditions
© 2017. The American Astronomical Society. All rights reserved.
Copyright ©
2025 Astronomy Image Explorer. All Rights Reserved.