Image Details
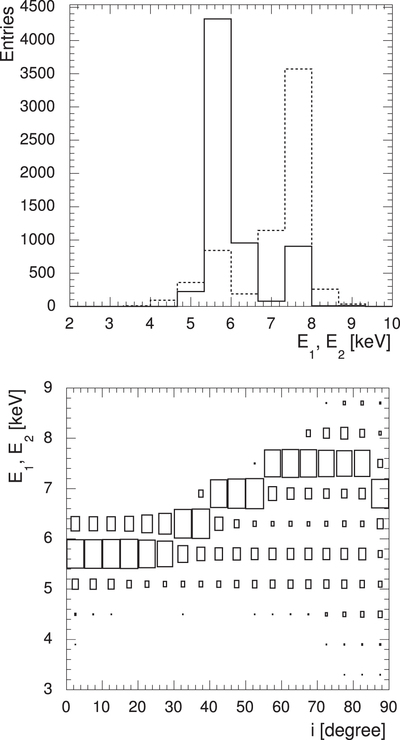
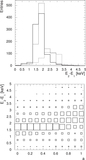
Caption: Figure 5.
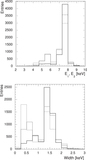
Top panel: spectral peak energies for inclinations of ﹩12\buildrel{\circ}\over{.} 5﹩ (solid line) and ﹩82\buildrel{\circ}\over{.} 5﹩ (dashed line) for all simulated caustic crossing angles and caustic offsets. Bottom panel: spectral peak energies as a function of inclination i (the box size is proportional to the number of simulated events). Both panels: ﹩a=0.5﹩, ﹩h=5\,{r}_{{\rm{g}}}﹩, ﹩\beta =0.5﹩.
Other Images in This Article

Show More
Copyright and Terms & Conditions
© 2017. The American Astronomical Society. All rights reserved.
Copyright ©
2025 Astronomy Image Explorer. All Rights Reserved.