Image Details
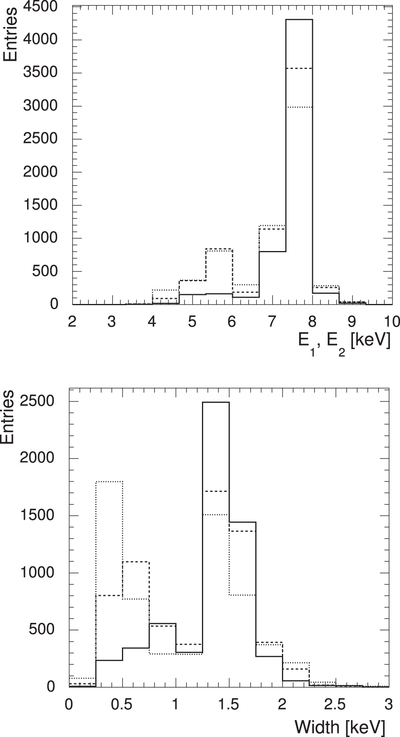
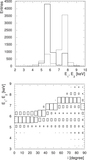
Caption: Figure 10.
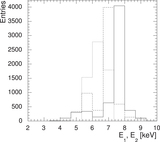
Distribution of spectral peaks (top panel) and spectral peak widths (bottom panel) for ﹩\beta =0.125﹩ (solid lines), ﹩\beta =1﹩ (dashed lines), and ﹩\beta =2﹩ (dotted lines) for ﹩a=0.5﹩, ﹩i=82\buildrel{\circ}\over{.} 5﹩.
Other Images in This Article

Show More
Copyright and Terms & Conditions
© 2017. The American Astronomical Society. All rights reserved.
Copyright ©
2025 Astronomy Image Explorer. All Rights Reserved.