Image Details
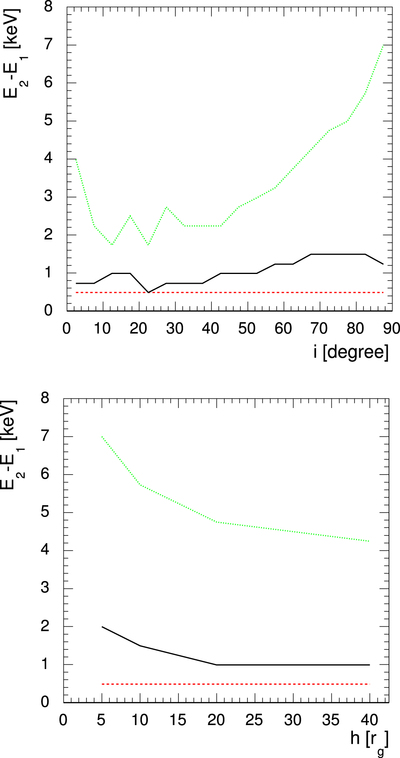
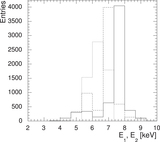
Caption: Figure 13.
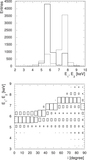
Range of the differences of the spectral peak energies of all doubles as a function of the inclination i (top panel) and corona height h (bottom panel). The dashed, solid, and dotted lines show the minimum, median, and maximum values, respectively.
Other Images in This Article

Show More
Copyright and Terms & Conditions
© 2017. The American Astronomical Society. All rights reserved.
Copyright ©
2025 Astronomy Image Explorer. All Rights Reserved.