Image Details
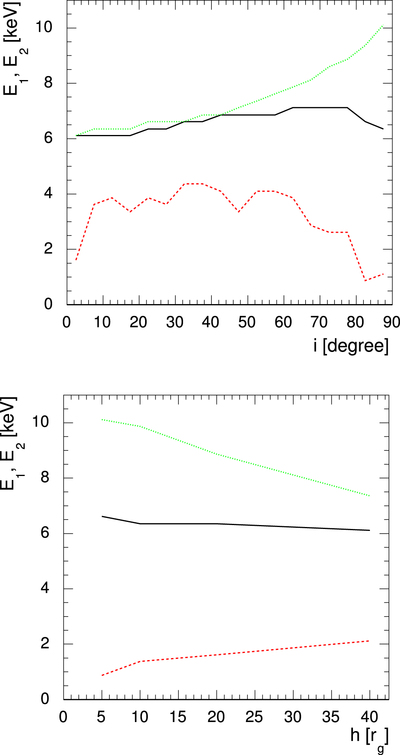
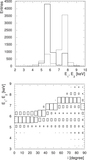
Caption: Figure 12.
Range of the simulated spectral peak energies as a function of the inclination i (top panel) and corona height h (bottom panel).The dashed, solid, and dotted lines show the minimum, median, and maximum spectral peak values, respectively. The minimum, median, and maximum values were determined by analyzing the distribution of the spectral peaks found in the energy spectra for all simulated black hole spins, all simulated caustic positions and orientations, all simulated corona heights (top panel), and all possible inclinations (bottom panel). Energy spectra with a single peak at energy E1 contribute a single entry to the peak energy distribution. Energy spectra with two peaks at energies E1 and E2 contribute two entries to the peak energy distribution.
Other Images in This Article

Show More
Copyright and Terms & Conditions
© 2017. The American Astronomical Society. All rights reserved.