Image Details
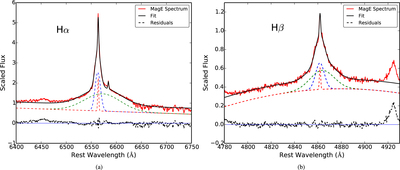
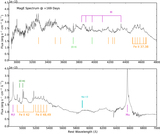
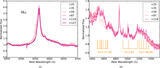
Caption: Figure 12.
(a) Three-component Gaussian fit (black) to the Hα profile from the MagE spectrum (red). The fit residuals (black dashed) and individual components including the narrow (red dashed), intermediate (blue dashed), and broad (green dashed) components are also shown. (b) Same as panel (a), but for the Hβ profile. This fitting procedure was carried out for each of our spectra.
Other Images in This Article
Show More
Copyright and Terms & Conditions
© 2017. The American Astronomical Society. All rights reserved.
Copyright ©
2025 Astronomy Image Explorer. All Rights Reserved.