Image Details
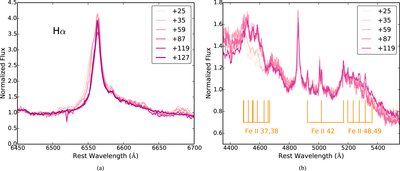
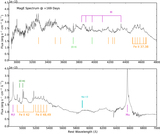
Caption: Figure 9.
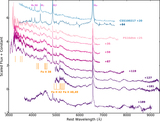
(a) Hα profile from our sequence of low-resolution spectra plus the initial +25-day spectrum obtained by Terreran et al. (2016). The profile is asymmetric with a redshifted broad base, a strong intermediate-width component, and a narrow peak. (b) Zoom-in on the region surrounding Hβ where the most prominent Fe II lines are located that form broad features with superimposed narrow peaks.
Other Images in This Article
Show More
Copyright and Terms & Conditions
© 2017. The American Astronomical Society. All rights reserved.
Copyright ©
2025 Astronomy Image Explorer. All Rights Reserved.