Image Details
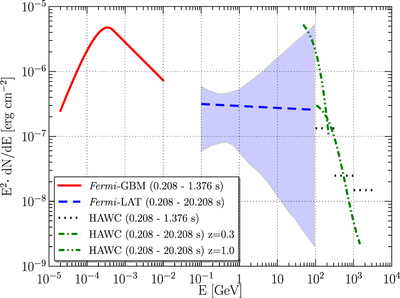
Caption: Figure 5.
Solid line (red) shows the spectrum fitted to the prompt Fermi-GBM data of GRB 170206, while dotted lines (black) show the “quasi-differential” limits assuming ﹩{E}^{-2}﹩ obtained from the HAWC data taken during the same time period. Dashed line (blue) shows the best-fit spectrum obtained from the Fermi-LAT data in the early afterglow and the shaded area the uncertainty taking into account the correlations and non-linearity of fit parameters. The green dashed−dotted lines show the HAWC limits for two different assumed redshifts.
Other Images in This Article

Copyright and Terms & Conditions
© 2017. The American Astronomical Society. All rights reserved.
Copyright ©
2025 Astronomy Image Explorer. All Rights Reserved.