Image Details
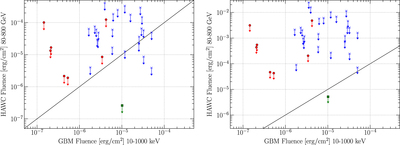
Caption: Figure 4.
Comparison between the Fermi-GBM fluence and the fluence implied by the HAWC upper limits obtained during the same time period for all GRBs completely inside the HAWC field of view for the two different redshifts (left panel: z = 0.3, right panel: z = 1.0). The circles (red) show short GRBs, the asterisks (blue) long GRBs, and the green square GRB 170206A. The black line shows an equal fluence in the Fermi-GBM and HAWC energy range.
Other Images in This Article

Copyright and Terms & Conditions
© 2017. The American Astronomical Society. All rights reserved.
Copyright ©
2025 Astronomy Image Explorer. All Rights Reserved.