Image Details
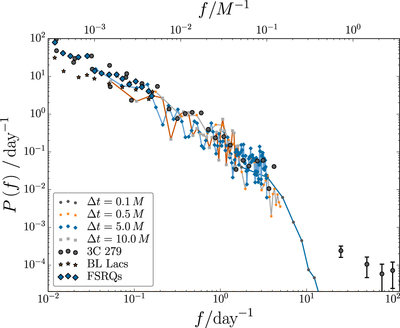
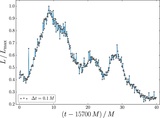
Caption: Figure 5.
Same as Figure 3 but showing the simulated PDS for the optical band. In this case, the light curves are dominated by synchrotron emission. The observational data again corresponds to energies ﹩\gt 100\,\mathrm{MeV}﹩. It is clear that optical PDS shows a similar power-law behavior to that in the γ-rays.
Other Images in This Article
Copyright and Terms & Conditions
© 2017. The American Astronomical Society. All rights reserved.
Copyright ©
2025 Astronomy Image Explorer. All Rights Reserved.