Image Details
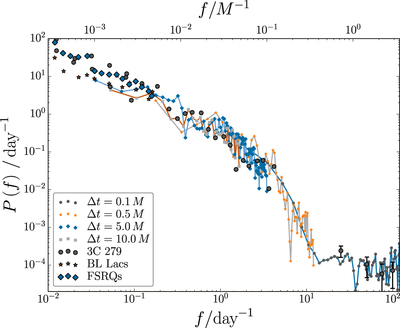
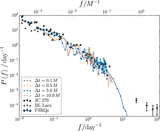
Caption: Figure 3.
γ-ray PDS corresponding to four light curves frequency integrated between ﹩{\nu }_{\min }={10}^{19}\,\mathrm{Hz}﹩ and ﹩{\nu }_{\max }={10}^{24}\,\mathrm{Hz}﹩. The time steps show the sampling of each light curve. The circles correspond to observational data from 3C 279 (Ackermann et al. 2016), while the stars and diamonds correspond to data averaged over BL Lacs and FSRQs (Abdo et al. 2010). The observational data corresponds to energies ﹩\gt 100\,\mathrm{MeV}﹩. Both BL Lacs and FSRQs show similar power-law behavior, and the simulated PDS agrees reasonably well with both of these. There is a clear cutoff in the spectrum above ﹩\sim 5\,{\mathrm{day}}^{-1}﹩. The white noise part of the spectrum above ﹩10\,{\mathrm{day}}^{-1}﹩ is due to poor photon statistics. Note that the top axis is scaled to a black hole mass of ﹩M=5\times {10}^{8}\,{M}_{\odot }﹩ for comparison with the data for 3C 279, while the averaged data from Abdo et al. (2010) corresponds to systems with different masses. The normalization on the y-axis is arbitrary and simply chosen to compare the shape of our simulated PDS to the observations.
Other Images in This Article
Copyright and Terms & Conditions
© 2017. The American Astronomical Society. All rights reserved.