Image Details
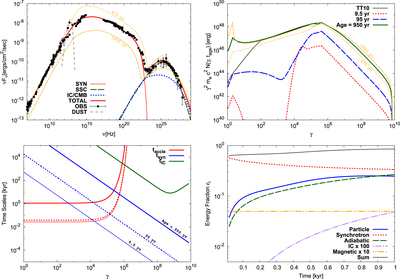
Caption: Figure 3.
Calculation results of Model 1: the current photon spectrum (top left), the evolution of the particle spectra (top right), the timescales (bottom left), and the evolution of the fractional energy (bottom right). See the caption in Figure 1 for details. In the top left and top right panels, the photon and particle spectra at 1/2tage = 475 years (dotted yellow) and 2tage = 1900 years (dashed yellow) are added (discussed in Section 4.1). The dashed yellow lines in the top right panel are the particle spectra at 10tage = 9.5 kyr. Model 1 adopts Qext = Qcont and finite values of τturb and γcut in Equation (5). The used parameters are summarized in Table 1.
Other Images in This Article
Copyright and Terms & Conditions
© 2017. The American Astronomical Society. All rights reserved.