Image Details
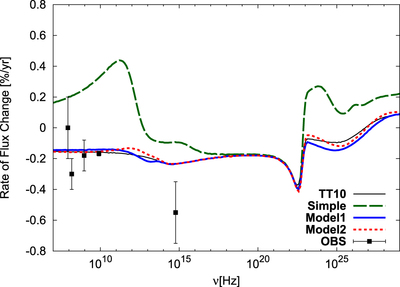
Caption: Figure 2.
The present rate of flux changes from radio to γ-rays for the different models with the observations (Vinyaikin (2007) for radio and Smith (2003) for optical). The thin black line is TT10. The simple continuous acceleration model (see Section 3.1) corresponds to the green dashed line. The thick blue and dotted red lines are the results of Models 1 and 2 in Section 3.2, respectively.
Other Images in This Article
Copyright and Terms & Conditions
© 2017. The American Astronomical Society. All rights reserved.
Copyright ©
2025 Astronomy Image Explorer. All Rights Reserved.