Image Details
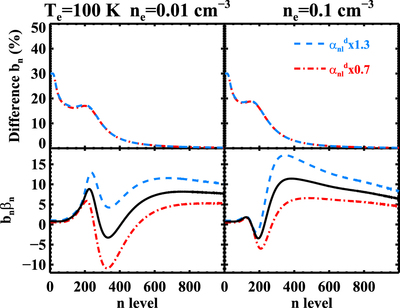
Caption: Figure 16.
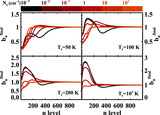
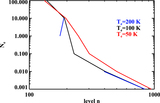
Upper panels: the difference (in percent) of the departure coefficients after multiplying the dielectronic capture rate by a factor of 1.3 (0.7) in blue (red) for a temperature of 100 K and densities of 0.01 ﹩{\mathrm{cm}}^{-3}﹩ (left) and 0.1 ﹩{\mathrm{cm}}^{-3}﹩ (right). Lower panels: ﹩{b}_{n}{\beta }_{n}﹩ for the same physical conditions as in the upper panels. At n levels lower than ∼200, the ﹩{b}_{n}{\beta }_{n}﹩ values derived by using the modified dielectronic capture rates (blue and red) are similar to those without modification (black). At higher levels the overall trends are similar, but they can differ by factors of a few.
Other Images in This Article

Show More
Copyright and Terms & Conditions
© 2017. The American Astronomical Society. All rights reserved.