Image Details
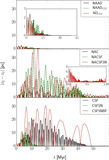
Caption: Figure 6.
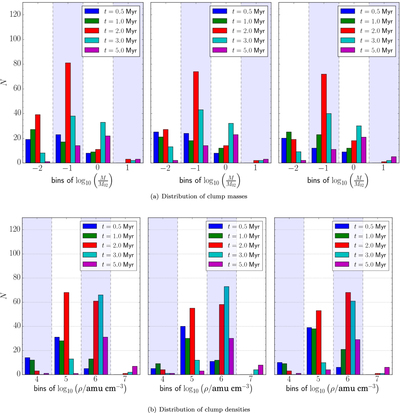
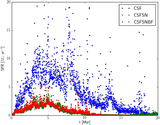
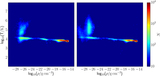
(a) Histogram of the clump mass distribution at different times for runs NAC (left), CSFSN (middle), and CSFSNBF (right). The horizontal axis is shown in terms of the initial mass of the secondary BH, to highlight the potential dynamical influence of a close encounter between the secondary BH and a clump in the disk. As time elapses, smaller clumps merge into larger ones, building up a sensible population of bound objects with mass comparable to or larger than that of the secondary BH. For reference, ﹩{M}_{02}=5\times {10}^{5}﹩ ﹩{M}_{\odot }﹩. The partition of the horizontal axis is taken from the approximate integer value of the logarithmic function, i.e., masses in the range ﹩\sim {M}_{02}\times {10}^{n}/3.16﹩ to ﹩\sim {M}_{02}\times {10}^{n}\times 3.16﹩ belong to the bin labeled by n. (b) Histogram of the clump density distribution, as in the upper panels. Densities were calculated considering the data retrieved by SKID (Stadel 2001). The mass and volume of a clump used for average density estimates correspond, respectively, to its total mass and to a sphere with the maximum radius of the clump.
Other Images in This Article
Show More
Copyright and Terms & Conditions
© 2017. The American Astronomical Society. All rights reserved.