Image Details
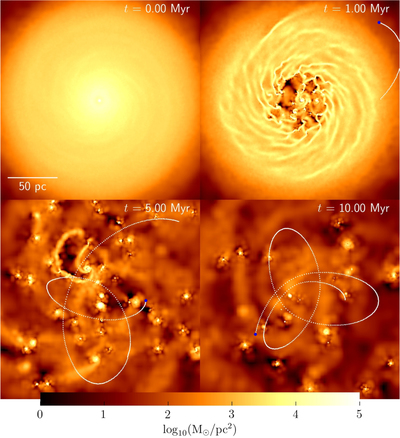
Caption: Figure 3.
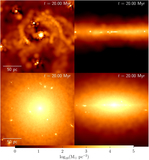
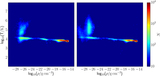
Gas density face-on projection and secondary BH’s trajectory for run C (see Table 1), similar to Figure 2. Notice the change of the scale and the surface density limits in contrast with that figure. The left and right upper panels show, respectively, the initial state of the gas and the fragmentation happening in the central regions of the disk. From the bottom left panel, we notice that the fragmentation timescale is fairly smaller than the timescale for the secondary BH to complete one orbit. As time elapses, many gaseous clumps are formed and interact with each other, scattering and combining to form fewer larger clumps. The environmental differences along the BH path, in comparison to the adiabatic runs, are enormous. This leads to a completely different interplay between the gas disk and the BH, as the latter moves through a more contrasted density background.
Other Images in This Article
Show More
Copyright and Terms & Conditions
© 2017. The American Astronomical Society. All rights reserved.