Image Details
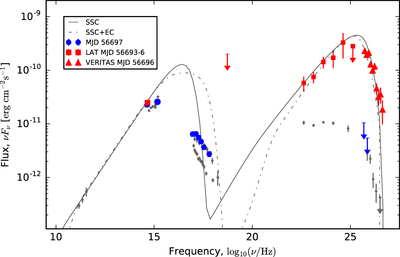
Caption: Figure 2.
Broadband SED of B2 1215+30 at different epochs. Red markers show the state of the source during the 2014 February 08 flare, including VERITAS (MJD 56,696.52), Fermi-LAT (MJD 56,693–56,696), Swift-BAT (MJD 56,696), and Tuorla (MJD 56,696.72) data. Blue markers show Swift-XRT and UVOT fluxes and VERITAS 95% c.l. upper limits taken 24 hr after the flare. Gray markers show archival observations from Aliu et al. (2013). The numerical SSC and SSC+EC models described in Section 6 are shown with a solid and a dashed gray line, respectively. Gamma-ray absorption by the extragalactic background light is applied to the models following Finke et al. (2010).
Other Images in This Article

Copyright and Terms & Conditions
© 2017. The American Astronomical Society. All rights reserved.