Image Details
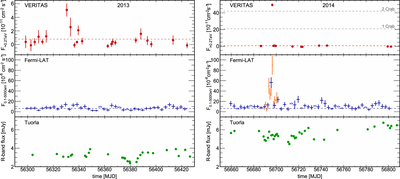
Caption: Figure 1.
TeV (top), GeV (middle), and optical (bottom) light curves of B2 1215+30 in 2013 (left panels) and 2014 (right panels). Fluxes are calculated in 1-day bins for VERITAS. Fermi-LAT fluxes are calculated with 3-day integration bins (blue plus signs) and 1-day bins (orange plus signs) around the time of the 2014 flare. Downward-pointing triangles indicate 95% c.l. upper limits derived from the Fermi-LAT data for time bins with signal smaller than 2σ. The yearly averaged TeV flux in 2011 (﹩8.0\times {10}^{-12}\,{\mathrm{cm}}^{-2}\,{{\rm{s}}}^{-1}﹩; Aliu et al. 2013) is shown by a red dashed line, and a blue dashed line indicates the average GeV flux from Acero et al. (2015). Statistical errors on the Tuorla optical fluxes are smaller than the data points.
Other Images in This Article
Copyright and Terms & Conditions
© 2017. The American Astronomical Society. All rights reserved.