Image Details
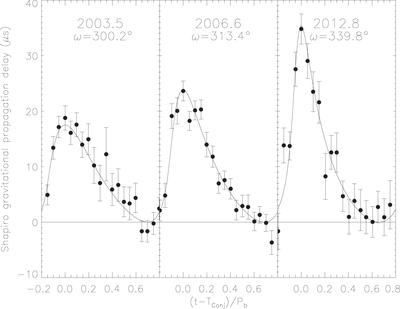
Caption: Figure 1.
Shapiro gravitational propagation delay variation around the orbit at three epochs. The curve represents the expected delay based on a general relativistic calculation, while the points and their error bars result from combining all residuals to a special fit (see text) near the given epoch into one of 20 orbital time bins. Time is reckoned with respect to TConj, the epoch of the pulsar’s superior conjunction with the companion. Each curve peaks at that epoch when the pulsar’s earthbound signals plunge most deeply into the companion’s gravitational well. The amplitude and shape of the curves evolve due to relativistic precession of the orbital ellipse, as quantified by the advancing longitude of periastron ω.
Other Images in This Article
Copyright and Terms & Conditions
© 2016. The American Astronomical Society. All rights reserved.