Image Details
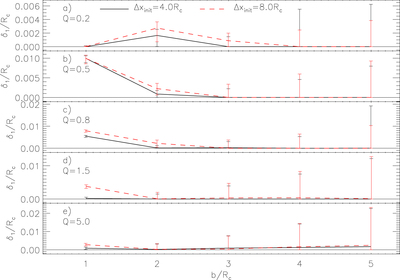
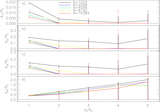
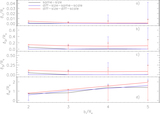
Caption: Figure 5.
Comparisons between prescription 1 softening lengths given different initial separations in the x-direction. Panels (a)–(e) correspond to results from simulations with ﹩Q=0.2,Q=0.5﹩, ﹩Q=0.8,Q=1.5﹩, and Q = 5.0, respectively. All simulations have Nc = 8192. Versions of this plot using information from different prescriptions and/or cluster density profiles show similar levels of agreement.
Other Images in This Article

Copyright and Terms & Conditions
© 2016. The American Astronomical Society. All rights reserved.
Copyright ©
2025 Astronomy Image Explorer. All Rights Reserved.