Image Details
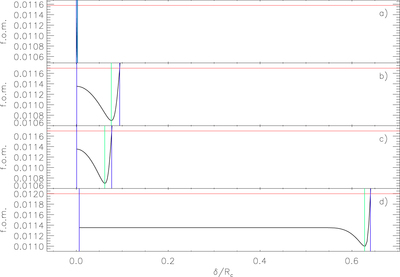
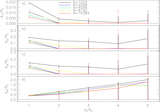
Caption: Figure 1.
Panels (a)–(d) show figure-of-merit curves for the first, second, third, and fourth softening prescriptions, respectively. These curves are based on a Plummer cluster simulation with ﹩{N}_{c}=8192,Q=0.2,﹩ ﹩{\rm{\Delta }}{x}_{{\rm{init}}}=4{R}_{c},﹩ ﹩{\rm{\Delta }}{z}_{{\rm{init}}}=2{R}_{c}﹩. The thin horizontal line indicates the limiting figure-of-merit value, minimum plus 10−3. The thick, solid vertical lines mark the low and high range values for the softening value, while the thick, dashed vertical line indicates the ﹩{\delta }_{{\rm{opt}}}﹩ value determined by the amoeba routine. Due to the rather large range imposed by the ﹩{\delta }_{{\rm{opt}}}﹩ value of prescription 4 and the rather small ﹩{\delta }_{{\rm{opt}}}﹩ value for prescription 1, it is nearly impossible to see the curve of prescription 1. However, viewing that curve individually reveals it to behave very similarly to the curves of prescriptions 2 and 3. Note that for prescription 4 (panel (d)) the minimum is actually nearer the high end of the range. This is a generic behavior for prescription 4 (see, e.g., Figure 3).
Other Images in This Article

Copyright and Terms & Conditions
© 2016. The American Astronomical Society. All rights reserved.