Image Details
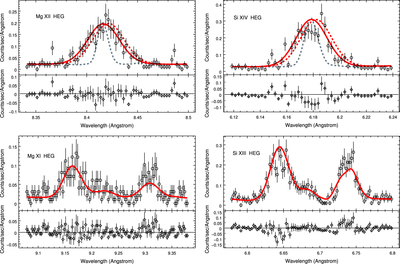
Caption: Figure 4.
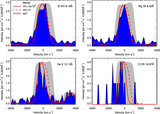
Best-fit three-temperature model (see the text) compared with the HEG spectra of the Mg (left) and Si (right) H-like (top) and He-like (bottom) lines. The models include a velocity broadening of 1200 km s−1 FWHM and a blueshift of 165 km s−1. The dashed curves in the top panels correspond to the “unshifted” (redshift z = 0; red dashed) and unbroadened (gray dashed) profiles. The latter have been renormalized arbitrarily so as to have the same peak count rates as the others. In the lower panels, the three line components are the resonance (left; ﹩1{s}^{2}{}^{1}{S}_{0}﹩–﹩1s2p{}^{1}{P}_{1}﹩), intercombination (center; ﹩1{s}^{2}{}^{1}{S}_{0}﹩–﹩1\;s2p{}^{3}{P}_{2}{,}^{3}{P}_{1}﹩), and forbidden (right; ﹩1{s}^{2}{}^{1}{S}_{0}﹩–﹩1s2s{}^{3}{S}_{1}﹩) lines. Their relative intensities correspond to the low-density limit (see Section 4.2.1).
Other Images in This Article
Copyright and Terms & Conditions
© 2016. The American Astronomical Society. All rights reserved.