Image Details
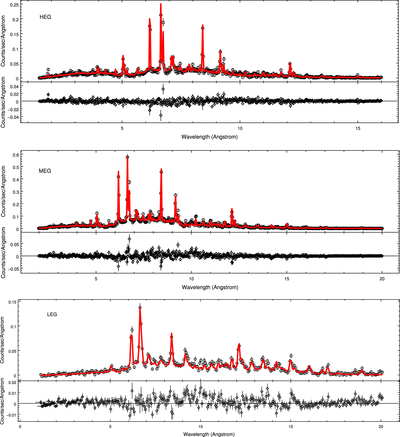
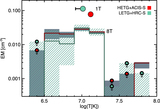
Caption: Figure 3.
Best-fit three-temperature model (see the text) compared with the HEG (top) and MEG (middle) spectra binned by 10 pixels, and similar best-fit LEG spectrum (bottom) model and data binned by 5 pixels. The lower subpanels of each illustrate the fit residuals.
Other Images in This Article
Copyright and Terms & Conditions
© 2016. The American Astronomical Society. All rights reserved.
Copyright ©
2025 Astronomy Image Explorer. All Rights Reserved.