Image Details
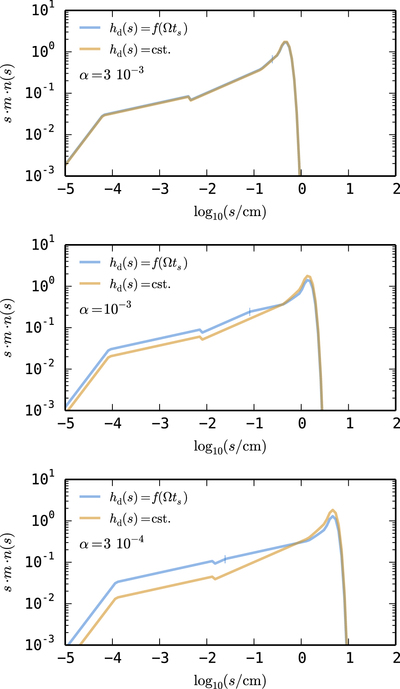
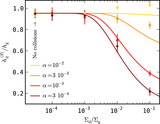
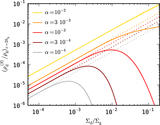
Caption: Figure 9.
Vertically integrated size distributions predicted by the recipe of Birnstiel et al. (2011, Section 5.2) for three different turbulence levels. The blue curves show the distribution when the settling is described by Equation (9), while the orange curves correspond to the case where all dust particles share the same scale height. The settling size ssett is indicated by the vertical marker. Differences are most pronounced when the turbulence is weak.
Other Images in This Article
Copyright and Terms & Conditions
© 2016. The American Astronomical Society. All rights reserved.
Copyright ©
2025 Astronomy Image Explorer. All Rights Reserved.