Image Details
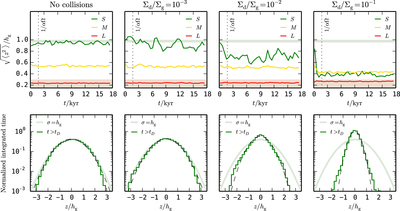
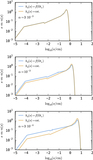
Caption: Figure 6.
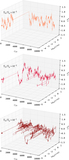
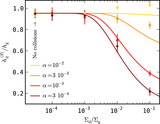
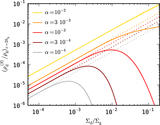
Dust particle distributions for ﹩\alpha ={10}^{-3}﹩ for different dust-to-gas ratios. Top: variance in the distribution of small (﹩{\rm{\Omega }}{t}_{{\rm{s}}}/\alpha \lt {10}^{-1}﹩), medium (﹩{10}^{-1}\lt {\rm{\Omega }}{t}_{{\rm{s}}}/\alpha \lt 10﹩), and large (﹩{\rm{\Omega }}{t}_{{\rm{s}}}/\alpha \gt 10﹩) particles as a function of time. The shaded areas indicate the expected scale heights for small and large grains (i.e., Equation (9)), and the vertical dotted line shows the mixing timescale ﹩{t}_{D}=1/(\alpha {\rm{\Omega }})﹩. Bottom: normalized distribution of small grains integrated over all times ﹩t\gt {t}_{D}﹩. The shaded green curve shows the expected distribution for well-mixed small grains and the dashed line shows a Gaussian fit to the data.
Other Images in This Article
Copyright and Terms & Conditions
© 2016. The American Astronomical Society. All rights reserved.