Image Details
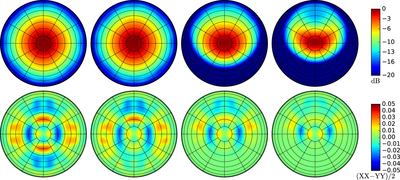
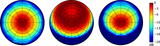
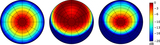
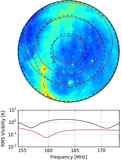
Caption: Figure 8.
Beam response patterns illustrating the application of fringe-rate filtering to minimizing polarization leakage. Panels from left to right illustrate the response before matching XX and YY polarization beams, the response after such matching, the subsequent application of an optimal power-spectrum sensitivity filter, and the application of a filter optimizing both sensitivity and polarization match. The top row depicts the Stokes I beam response in logarithmic units; the bottom row shows the polarization match ﹩(\mathrm{XX}-\mathrm{YY})/2﹩ in linear units. The fringe-rate filters optimizing sensitivity and polarization match correspond to the red and green curves in Figure 3, respectively. The third column most closely corresponds to the fringe-rate filter applied in Ali et al. (2015).
Other Images in This Article
Copyright and Terms & Conditions
© 2016. The American Astronomical Society. All rights reserved.