Image Details
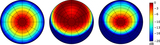
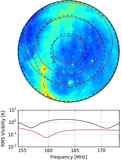
Caption: Figure 6.
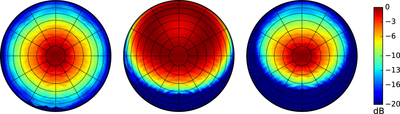
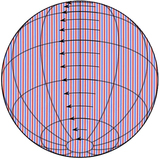
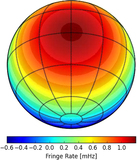
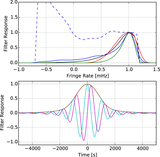
The effective primary beam response of a baseline, as reconstructed from point-source simulations described at the end of Section 4.1 and illustrated in Figures 4 and 5. The left panel shows that PAPER’s model beam response is recovered from unfiltered visibilities; the center panel illustrates the beam weighting that results from applying a fringe-rate filter tuned to optimize sensitivity for power spectrum measurements, assuming an isotropic primary beam; the right panel shows the effective response after applying this fringe-rate filter to data including PAPER’s model beam response. The periodic structure along the vertical axis is an artifact of reconstructing beams from point sources spaced every 5° in declination; we emphasize that they are not associated with any fundamental structure associated with fringe-rate filtering.
Other Images in This Article
Copyright and Terms & Conditions
© 2016. The American Astronomical Society. All rights reserved.